by Scot Mussi | Oct 20, 2010 | News and Updates, Uncategorized
The Daily Kos reported on a survey that shows Jon Hulburd leading Ben Quayle by two points. If that raises your eyebrows, there’s a good reason. The survey was conducted by Democrat firm Public Policy Polling, which in addition to Democrat clients, also conducts surveys for the Daily Kos, a liberal blog.
Having Democrat clients doesn’t make PPP’s numbers wrong outright, but the problem for PPP is that their numbers are increasingly suspicious and in favor of Democrats. For example, PPP is the only firm to claim that Democrat Joe Sestak is now in a dead heat with Republican Pat Toomey in Pennsylvania. Results that are questionable for good reason.
From the Weekly Standard:
Jay Coat’s advice: “Bookmark the 2008 (a great Democratic year), 2006 (a good Democratic year), and 2004 (a slightly good Republican year) exit poll sites — and before you accept any poll, cross-reference what it predicts the electorate will be with what it was in those past years. This is so important this year because I think polls are increasingly being used to move public opinion rather than to inform us about it.”
In 2004, the partisan breakdown in Pennsylvania was 41% Democrat, 39% Republican, 20% independent.
In 2006, it was 43% Democrat, 38% Republican, 19% independent.
In 2008, it was 44% Democrat, 37% Republican, 18% independent.
And what does PPP predict the partisan makeup of the electorate will be in 2010? 48% Democrat (!), 41% Republican, 11% independent.
Nate Silver, from NY Times FiveThirtyEight also isn’t buying it.
Toomey beats Sestak and Quayle trounces Hulburd.
The GOP turnout will dwarf Democrat turnout in AZ, especially when it becomes clear east of the Mississippi that Republicans have retaken control of the U.S. House. There will be even fewer compelling reasons for many Democrats to vote.
by Scot Mussi | Oct 20, 2010 | News and Updates, Uncategorized
Chart from Heritage Foundation. Thanks to Goldwater Institute for pointing it out.

by Scot Mussi | Oct 18, 2010 | News and Updates, Uncategorized
In my previous post, I used a graph to illustrate how state spending in Arizona hasn’t been cut enough, not only compared to actual revenue collections, but based on what prognosticators thought revenues would be. The point of my graph was to show how spending consistently outpaced revenues and to illustrate why the deficit in AZ ($1.7 billion) is as big as it is (even though spending has been reduced somewhat).
Paul Krugman, who runs Conscience of a Liberal blog for the NY Times, uses this graph to show that the reason the federal budget deficit is so large is not because federal spending has exploded, but because revenues collapsed.
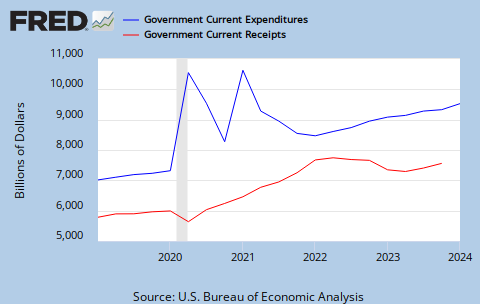
Ok, great. Federal spending (blue line) continued to outpace revenues (red line) when times were good, and now that times are bad, federal spending only continued to grow as if the economy was humming along just fine.
The deficit would be far worse if Krugman had his way (which he admits). He has argued for a year that the Bush/Obama response to the economic meltdown was way too little and way too late. He continues to argue for lots more spending to get the economy moving again.
I suppose there’s some silver lining that the blue and red lines can be viewed on the same screen.
by Scot Mussi | Oct 14, 2010 | News and Updates, Uncategorized
There are many line items in the state budget, both on revenue side and the expenditure side. As a matter of practice, when looking at the budgets from fiscal year to fiscal year, we like to look at net ongoing revenue vs. the appropriated operating budget.
Net ongoing revenue is the most conservative estimate for what state government can reasonably count on having. It doesn’t count any one-time revenues like carry-forward balances, fund-transfers, agency sweeps, sale lease-backs, and other one time revenue gimmicks. Similarly, the appropriated operating budget includes the vast majority of ongoing government expenditures. It doesn’t count supplemental spending, adjustments, repaying government transfers, litigation payments, or other one-time expenditures.
What we see from fiscal years 2006 through 2011 is not just disturbing, but it explains how Arizona policymakers have saddled Arizona taxpayers with nearly a near $2 billion budget deficit, and increases in both sales and property taxes. As revenues exploded, government spending did its best to catch up.
Growth in government spending should be limited since the bigger government gets, the more it crowds out private sector investment. Arizona now spends over $250 million a year just on debt service alone. That’s money that could be better used somewhere else.
What this graph shows most vividly is that Arizona needs real spending restraints. These spending figures were adopted (meaning voted on and signed by the governor). Adjustments were made, but lawmakers essentially adopted budgets they knew they couldn’t reasonably cover. A spending limit would not have prevented the near 40% decline in revenues Arizona has experienced, but it would have mitigated the size of the deficits, curbed our growing debt, and certainly would have prevented the three-year, $3.75 billion hike in sales and property taxes.
Click image for larger view.

by Scot Mussi | Oct 8, 2010 | News and Updates, Uncategorized
From the AZ Democratic Party:
Poll by respected researcher Bruce Merrill indicates tighter governors race than right-wing Rasmussen polls. http://ow.ly/2QQAE
First, Bruce Merrill might be a respected person, friend, father, neighbor . . . but in political circles, he’s not a respected pollster.
Second, Merrill’s survey was paid for by Goddard’s campaign. Now, that doesn’t make the numbers wrong, but since Brewer isn’t paying for Rasmussen’s polls (which show her leading by 16 points), it kind of lets the air out of the balloon.
Third, adding insult to injury, the Oct. 5 NY Times model has Brewer up 15%. No, not the right-wing NY Times . . . the real one.

Recent Comments